

Find, Fix and Avoid Crowding and Positioning Risk
Author:
Katerina Palamountain, Director of Business Development
Srey Jain, Director of Business Development
Deleveraging is fast, chaotic, and unforgiving. When market stress hits, it’s not always the weakest companies that fall first—it’s the most crowded trades.
Recent volatility sparked by tariff headlines starting in early 2025 offers a clear case study in how positioning—not fundamentals—can drive performance under pressure. At S3 Partners, we observed this dynamic unfold in real time using our S3 MAP (Market Analytics & Positioning) dataset, which track institutional long interest across tens of thousands of global securities.
Below, we break down what happened using our dataset, what it revealed about systemic market risk, and how risk managers can get ahead of the next round of forced unwinds.

Crowding Builds Slowly. Deleveraging Happens All at Once.
In stable market conditions, active fund crowding tends to reward managers: the most popular names often outperform thanks to high conviction and positive flow momentum.
But when macro headlines hit—like the tariff developments in Q1 2025—that same crowding becomes a liability. Risk models flag correlated exposures, margin pressure intensifies, and suddenly the most held names become the first to unwind. We’ve seen this pattern before—during the COVID crash in March 2020, the inflation-driven selloff of 2022, and the Treasury yield spike in 2023. And it happened again following the tariff headlines earlier this year.

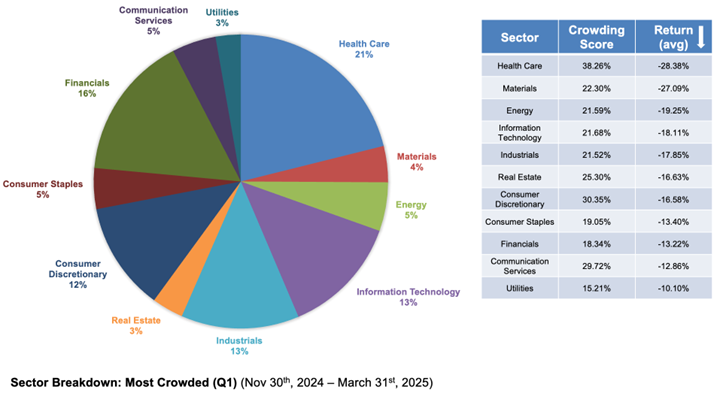
Our analysis of the Russell 3000 ranked stocks by the S3 crowding indicator, which measures the percentage of shares outstanding held by institutional investors, and grouped them into quintiles. The results were telling:
Quintile 1 (most crowded) declined by -19.14%
Quintile 5 (least crowded) declined by -12.57%
That 6.5-point gap had a lot to do with liquidity and positioning risk.
This Was a Systemic Correction—Not Just a Bad Trade
Sector-level analysis adds further context. Within the most crowded quintile (Q1), Healthcare, Materials, and Energy names experienced the steepest drawdowns.
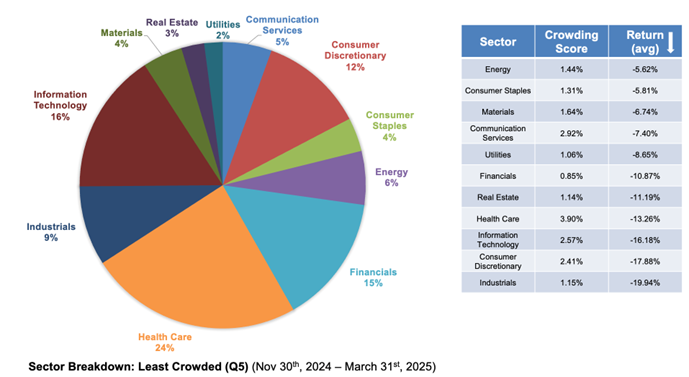
Meanwhile, the least crowded names (Q5) were notably hit less - highlighting the protective nature of uncorrelated institutional flows. Within the least crowded names in Quintile 5, were names in Energy, Consumer Staples and Materials. This dispersion across similar sectors suggests the selloff wasn’t sector driven. It was position-level deleveraging.
Hence, let’s do a deep dive into the actual positions. Among the top 10 most crowded names, Hertz (HTZ) and Avis (CAR) are worth mentioning —both were heavily owned and suffered large declines.
Hertz, with a crowding score of 65.21%, ownership score of 89 and held by 37 funds, fell nearly 20%. Its EV strategy reversal and used car depreciation created operational headwinds, but it was crowding and concentration that amplified the collapse.
Its ownership score of 89 is worth noting here. S3 Ownership Score is a composite score from 0 - 100 that measures fund participation as well as security long concentration. The higher score implies more monopolistic ownership, meaning one owner can own most of the security with a highly concentrated position.
Thus, Hertz was not only crowded but also a highly concentrated name, where most of this position is owned by only a few funds (i.e. Pershing Square Capital).

Avis, held by 57 funds with a crowding score over 61% and ownership score of 63, dropped more than 30%, largely due to a systemic forced unwind triggered by concentrated ownership and risk aversion.
These are prime examples of how concentrated positioning can turn crowded stocks into collateral damage during deleveraging events.

In contrast, several of the least crowded names posted positive returns during the same period.
O’Reilly Automotive, Sunoco, and Berkshire Hathaway not only avoided steep losses—they gained.
Why? They weren’t as crowded and less concentrated. Lower active fund flow meant less pressure to sell.

This asymmetry in outcomes illustrates the power of the S3 MAP data: it reveals not just what investors own—but how exposed those positions are to liquidity stress and systemic flow shocks.
Key Takeaway: Positioning Risk Is Systemic Risk waiting to happen
The tariff-driven deleveraging of early 2025 is a warning shot. In today’s environment of macro fragility, positioning risk needs to be part of every portfolio risk model.
S3’s MAP & Long Interest data provides:
Weekly prediction for long regulatory filings - a forward-looking view into institutional long positioning—well ahead of regulatory 13F filings
Insight into institutional long exposure that
classifies fund behavior across nine distinct hedge fund cohorts, and distinguishes between active and passive flows using a proprietary turnover model
Includes S3 Ownership and Concentration Scores - proprietary scores measuring the impact of the number of holders and the shares they own relative to the total ownership, generating crowding and concentration scores
Helps to identify securities with high hedge fund ownership, long side crowding, heavy active flows, or tight cross-fund overlap
A way to stress test portfolios for correlated risk before the next shock hits
See the Crowding Risk. Avoid the Trap.
Whether you're watching for recession triggers, sector rotations, or liquidity squeezes, positioning visibility is no longer optional.
S3 Partners delivers long and short interest data that helps risk teams quantify vulnerability, reduce overlap, and stay out of the next forced unwind – Giving you a 360° View of market positioning!
Don’t just manage risk—anticipate it with the S3 MAP & Long Interest datasets.
The information herein (some of which has been obtained from third party sources without verification) is believed by S3 Partners, LLC (“S3 Partners”) to be reliable and accurate. Neither S3 Partners nor any of its affiliates makes any representation as to the accuracy or completeness of the information herein or accepts liability arising from its use. Prior to making any decisions based on the information herein, you should determine, without reliance upon S3 Partners, the economic risks, and merits, as well as the legal, tax, accounting, and investment consequences, of such decisions.